During my little league catching days, I earned playing time through my blocking acumen. It wasn’t so much skill as it was effort– I collapsed on balls in the dirt with extreme enthusiasm, because it was one of the few areas I could contribute to the team. We had backstops with better arms and bats, and I had to find a way to compete. Most league catchers averaged ten passed balls per game, and I averaged seven, so I got the start.
My bat and arm never caught up to my blocking, and my baseball career ended accordingly. My fascination with catching hasn’t slowed down, however, and recently I wanted to attack a new question with catcher analytics: how catchers age. Because if my 12-year-old knees were sore after two 6-inning games every week, I can only imagine how Salvador Pérez’s limbs feel.
I came across the delta method for aging curves this month when Tom Tango brought the method to swing speed. The delta method involves pairing up player seasons and finding the difference in a statistic between the paired seasons.
For example, in Cal Raleigh’s age-26 season (2023), he totaled 6 framing runs. In the next year (2024), he amassed 13 framing runs. For this pair of seasons, he has a ‘delta’ of 7, or 13 minus 6. When you average many player’s deltas between their 26 and 27 year old seasons, you can see the typical development (or decline) between those years for the chosen stat. When you chain this pair of seasons to every other pair from 20 to 40, you get a whole aging curve– how you might expect a player to age over the years.
Tango was the first to write about the method and since then it’s taken on many different roles, statistics and improvements, from him and other analysts. Mitchell Lichtman wrote an extensive piece using the method, and then looked at how he could tweak it to avoid survivorship bias. There’s too many good articles to link all of them, but I will shout out Jeff Zimmerman’s aging curve study for hitters, and later on, Zimmerman and Bill Petti’s equivalent series on pitchers.
Combing through this analysis, I thought there might be a gap: why not catchers? Tango used delta methods for a short post on framing runs, but I think there’s plenty more to dive into. I broke Catcher Defense down into five key statistics available from Baseball Savant: framing runs, throw speed, pop time to second base and blocks above average.
I used the delta method to construct aging curves for each, with data from 2021-2024. The y-axis is the cumulative average change (delta) in each statistic starting from zero, and the x-axis is age. I weighted the delta averages with playing time, depending on the statistic I’m analyzing: number of called pitches for framing runs, number of total pitches for blocks above average and second base steal attempts for the throw-based aging curves. As a final note, all my charts only show data points where there are three or more players in the age bucket– otherwise, one standout improvement or decline can make the entire graph misleading.
Chalk it up to my soft spot for catchers from my youth baseball career, but I think those old knees deserve some more love.
Framing
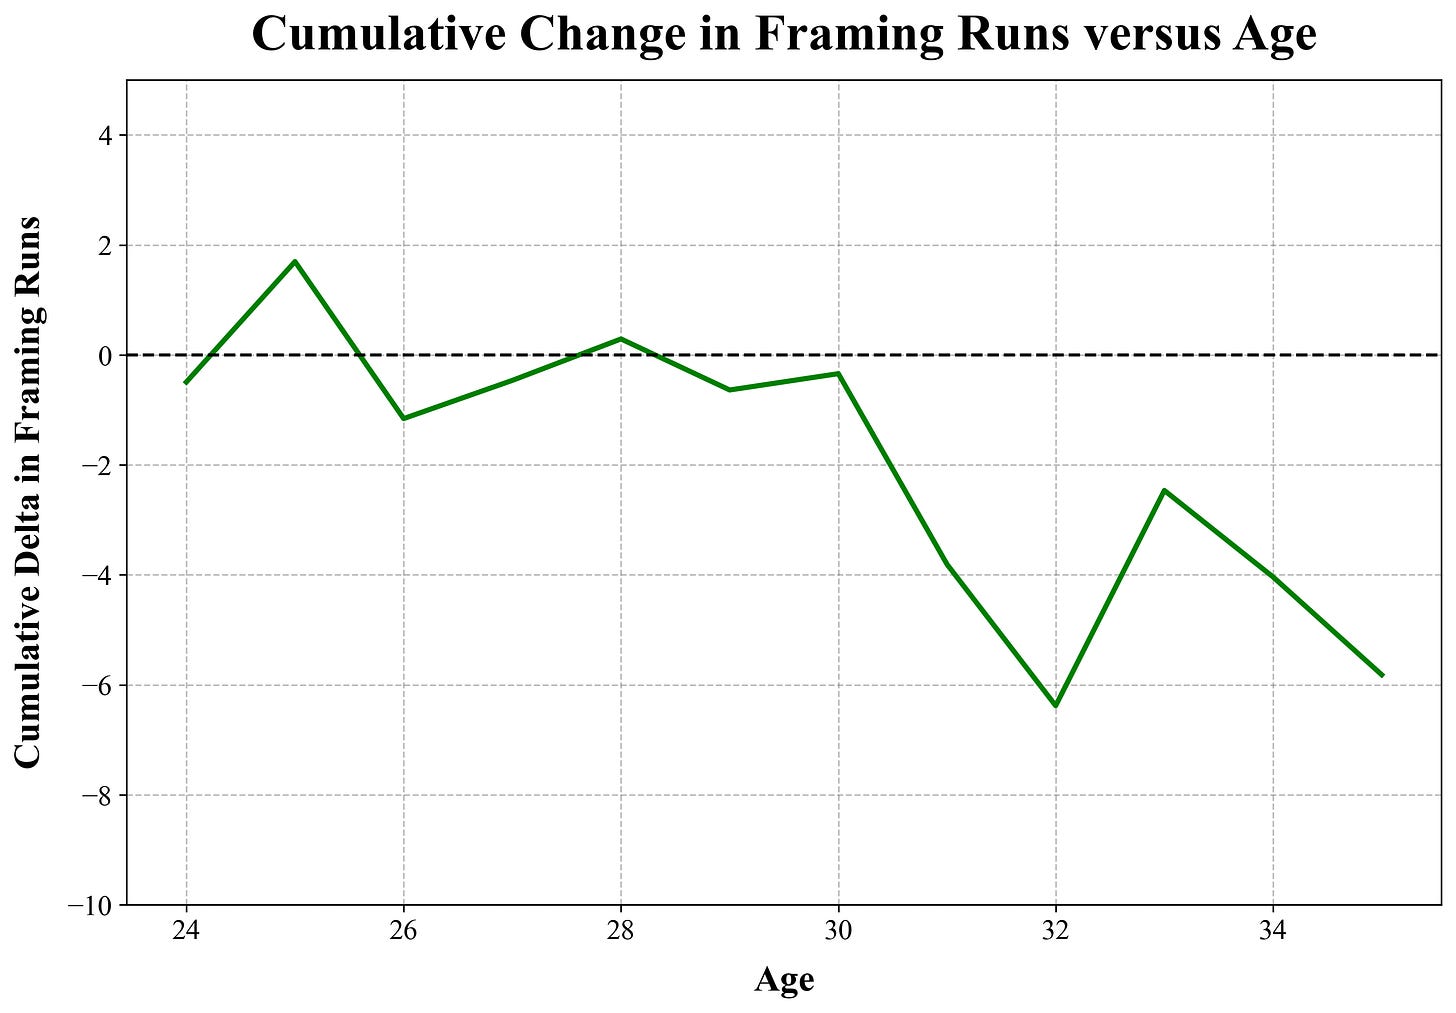
There’s a solid group of catchers in the sample that greatly improved their framing in their age-25 season, suggesting that a framing breakthrough might not happen immediately upon entering the league but a couple years later. It seems possible that teams want their young catchers to focus on other areas first, maybe on the offensive side, before they perfect the art of framing. Keibert Ruiz this most recent season and William Contreras in 2023 lead this age-25 spike. Ruiz shows up multiple times in my data with major gains, maybe sparked by a few key adjustments from the Nationals staff. Contreras gets his major framing development in the season after being traded to the Brewers– an organization with a reputation for their cheat-code catching lab.
After the age-25 spike, the framing abilities regress and then stagnate, with no discernible change from 26-30. From 31 onwards, there’s a general overall decline. The 33 year old bump is driven by 2024 framing rebound seasons from Elias Díaz and J.T. Realmuto. Before moving on to throwing, I wanted to check if playing time was affecting this framing curve. More pitches to frame gives catchers more opportunity to rack up framing runs, either positive or negative. With this in mind, I also made a graph on framing runs per called pitch:
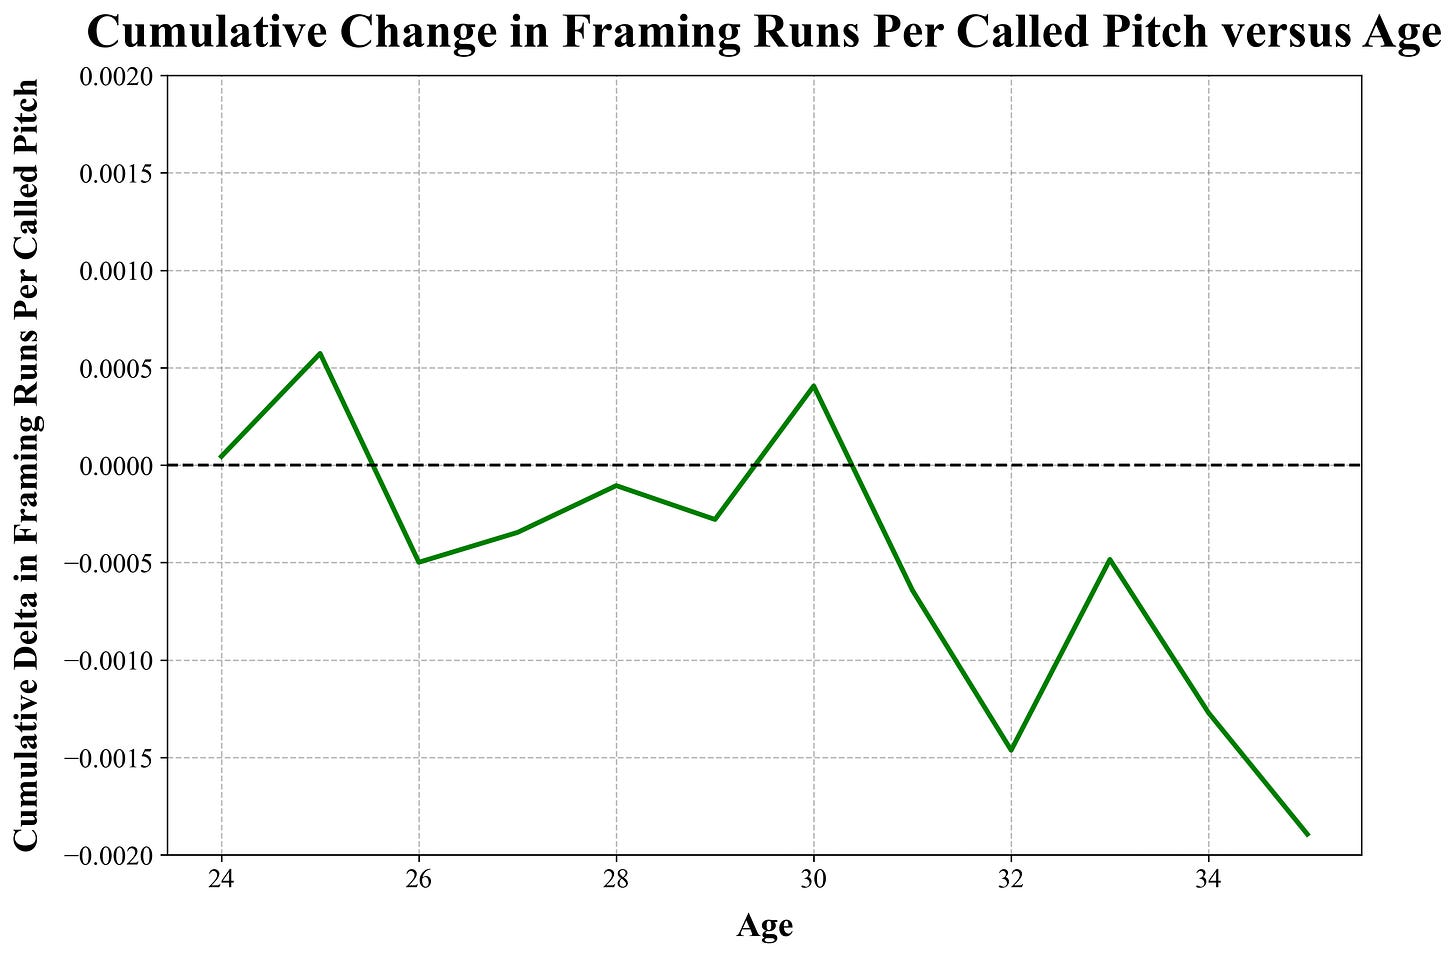
The shape stays very similar, though we do see the biggest change in the age-30 season. Maybe catchers are able to improve receiving on a per pitch basis later on in careers if they’re spending less innings behind the plate, and therefore less fatigued.
Throwing
Out of all the statistical categories I tested, I guessed throw speed would be the most clearly linked to aging. Unlike framing and blocking, I figured fading physical talent would outweigh any gains in technique for aging backstops.
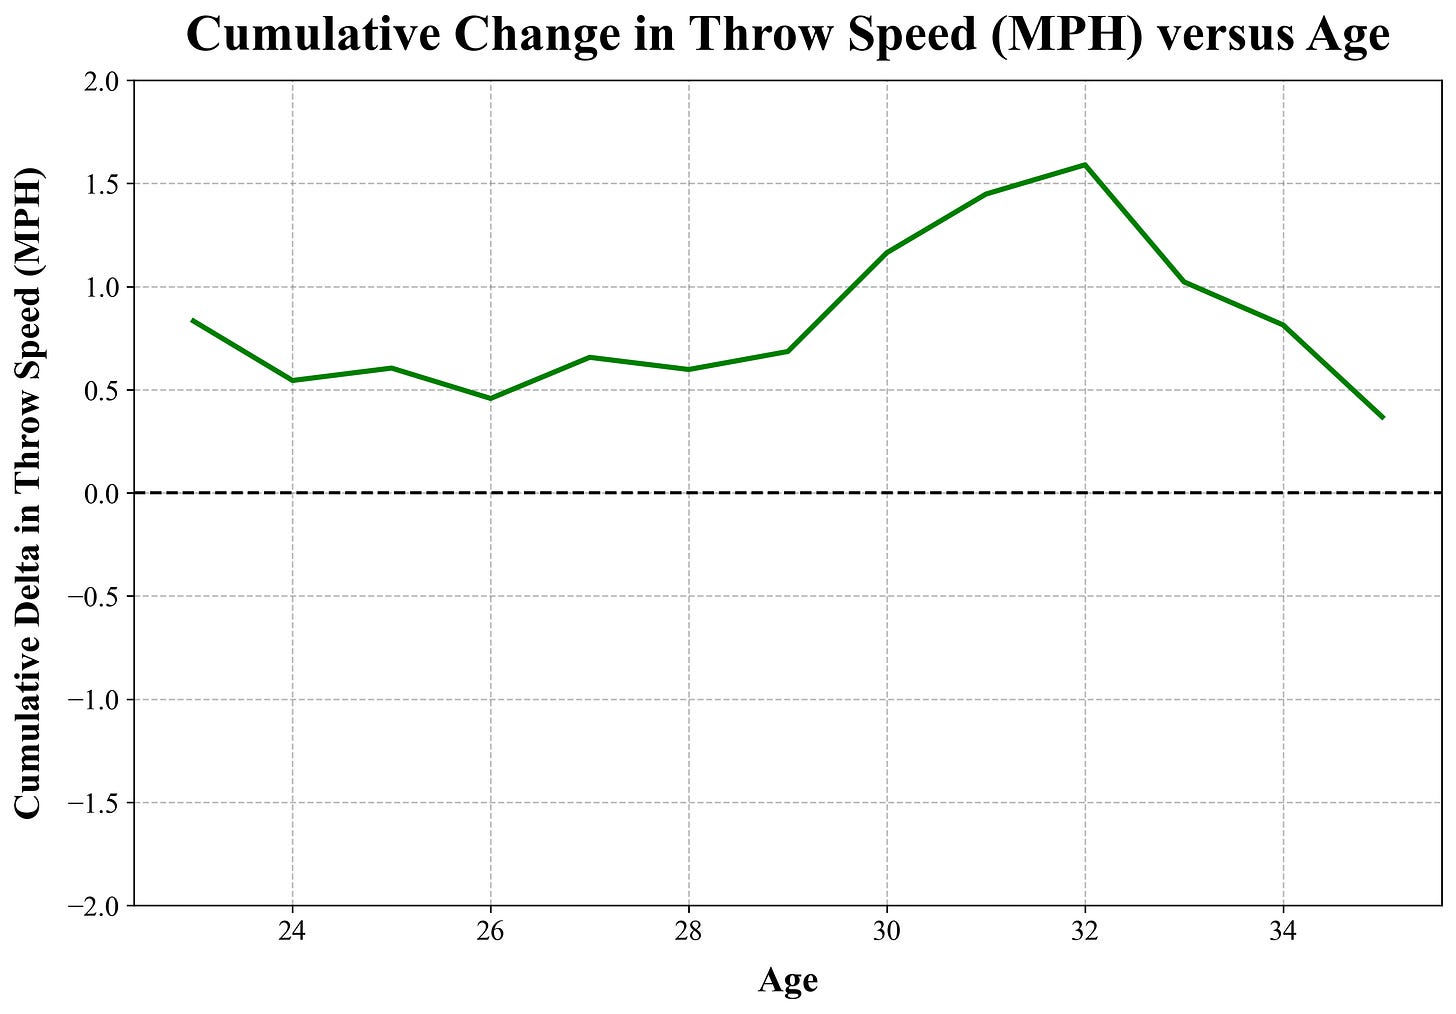
You can thank Keibert Ruiz again for the bump between ages 22 to 23, and then catcher throw speeds don’t change much through about 28. Those big gains from ages 29 to 32 are fascinating, as those are the years I expected would be strict declines. The increase in throw speed is fairly universal, as there are no clear culprits pumping up the whole group’s numbers. From Max Stassi to Austin Nola to Gary Sánchez, several catchers gained over 1 MPH on their throw speed during their age-31 season. I don’t have any great theories for why this spike, but maybe it’s a catcher mid-career crisis: as they hit 30 years old, they suddenly devote themselves to pushing arm strength and controlling the running game. Time still catches up to them though, as there’s a clear decline after 32. The analysis on pop time to second base is similar. (Of course, the image is mirrored– higher throw speed means lower pop time.)
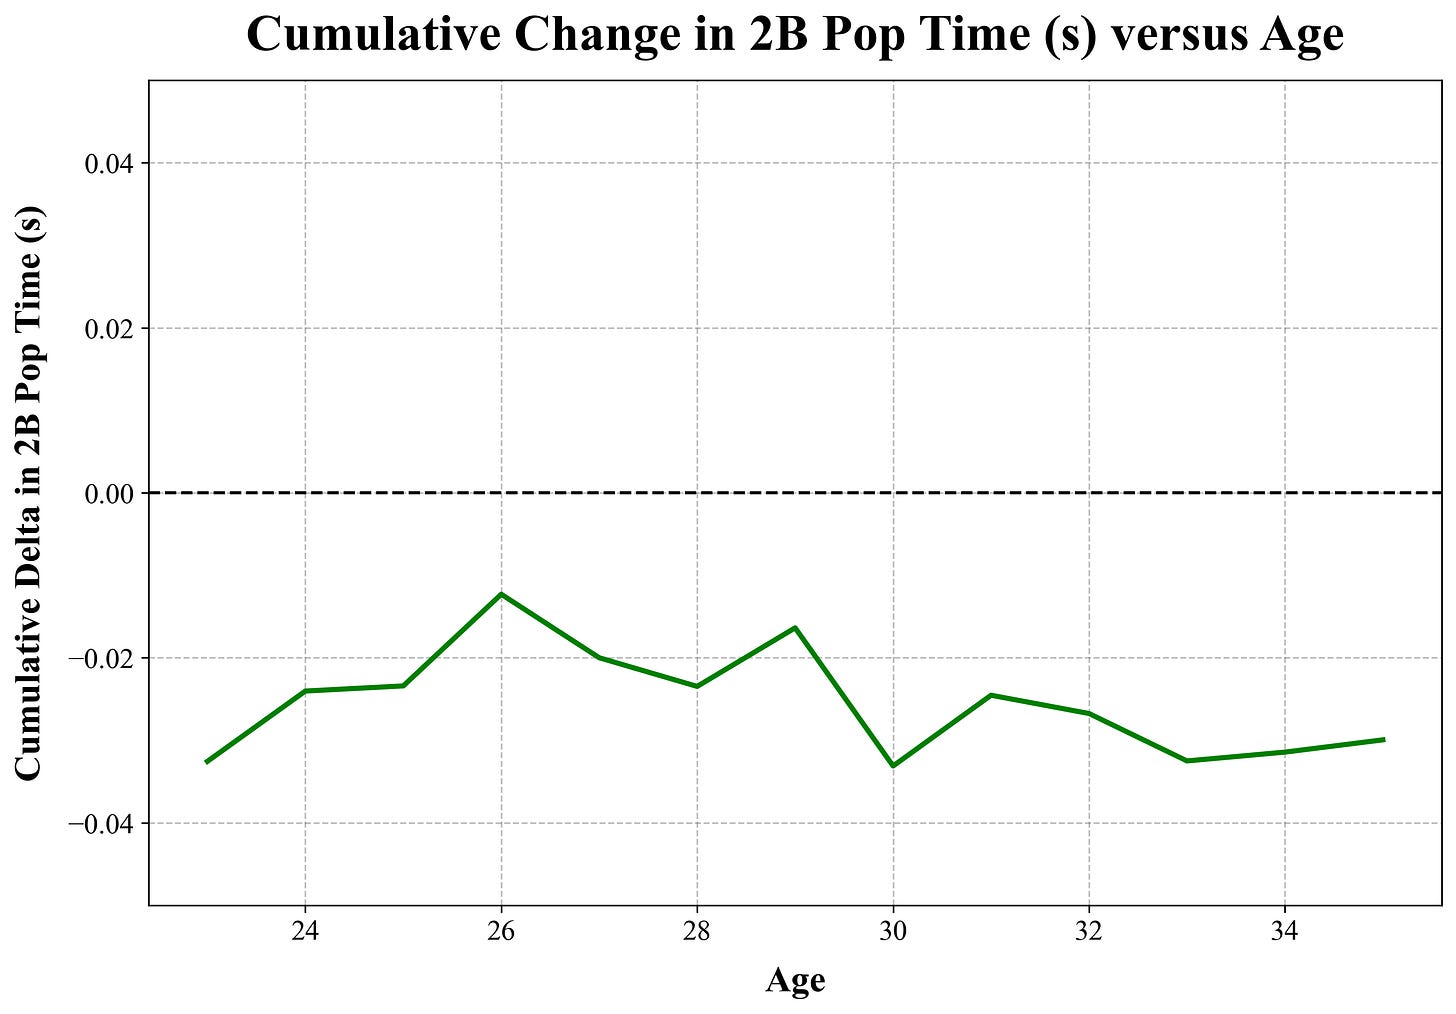
Interestingly, pop time doesn’t have that steep decline after age 32 like throw speed did. To investigate this, I had to apply the method to exchange time:
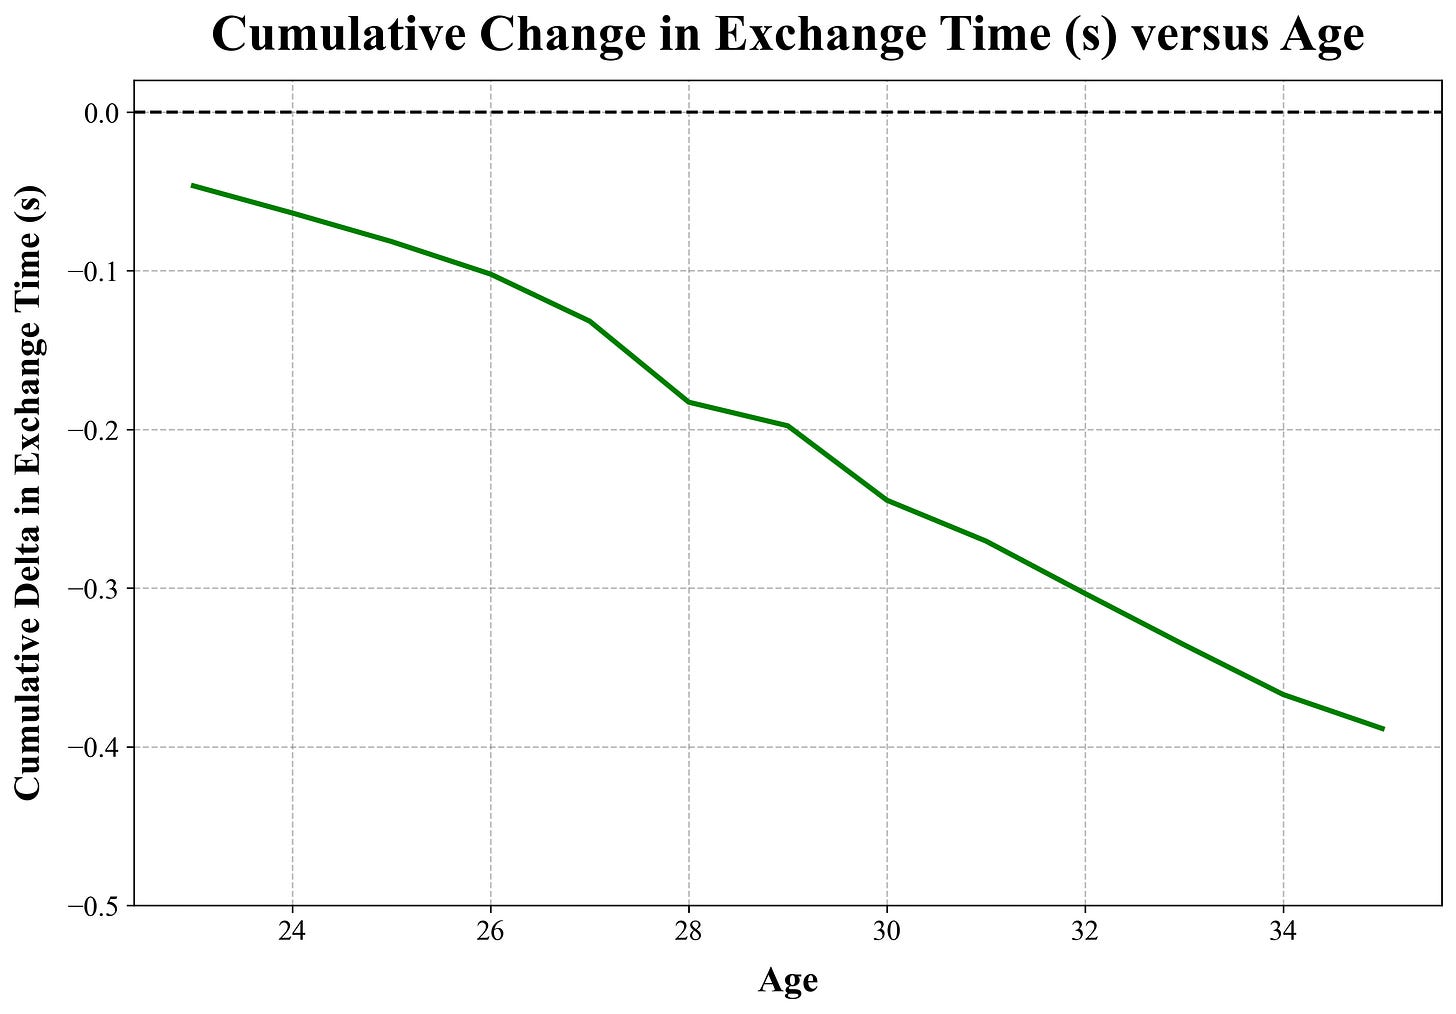
Arm strength is the most important factor in reducing pop time, but exchange time is by no means something to ignore. This last chart shows off the technical nature of catcher exchanges: on average, catchers improve (decrease) their exchange time every year. As far as I’ve seen, no other statistic from anywhere in baseball has this characteristic. This makes sense, as exchanges can be practiced and perfected even as physical advantages falter. It can also help to explain why pop time doesn’t fall off at the end of career, as quicker exchanges can counteract their slower throws.
Blocking
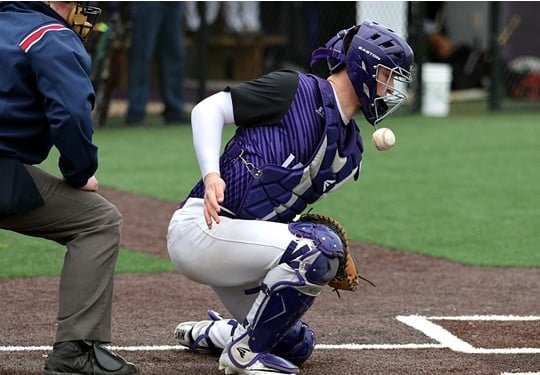
Blocking and framing move in opposite directions in a catcher’s early to mid-20s, and I wonder how much the two are related. Analysis shows that the one knee down stance doesn’t reduce blocking ability, but I still question if a framing priority can negatively affect blocking. Emphasizing framing might come in development, if teams are having their catchers channel time and effort to strike stealing rather than blocking. Good receiving is simply more valuable than good blocking.
Blocking peaks at age-29, which would make sense as an intersection of youthful flexibility and wise technique. After that age, older catchers are going to decline. Teams have gotten better in reducing catcher workload, but blocking in particular is brutal on your body. The delta method shows that blocking ability decreases as catchers age into their 30s.
Final Words
As a uniquely strenuous and technical position, it’s important to understand how exactly catchers age in the three key facets of their defensive game– framing, throwing and blocking. Knowing how a typical catcher develops and declines can help us make better projections going forward, and may give insight into how teams are looking for their catchers to improve. If your favorite team has a young catcher heading into their arbitration years, don’t count on them becoming a significantly better framer– but don’t be surprised if they get a mid-career boost in throwing and blocking.
I’d love to expand this project with data from younger levels. The best high school, college and minor league catchers are constantly progressing their skills behind the dish. How quickly they improve, and at what ages or levels, would be valuable information.
However, I am a little worried about what that information would have meant for my career as a little league catcher– I think a Hawk-Eye system in my local ballpark would have exposed some gaping flaws.


Great post, Quinn!
It’s really surprising that catcher’s throwing speed maximizes at 32! Good report!
Great work, Quinn!